


A quarter of all U.S. children are Latino
Data collected over a decade also shows that the Latino population aged faster than other population groups.
MORE IN THIS SECTION


The Latino community continues to move ever closer to being the majority in the U.S.
The most recent evidence of that trend is more data from the 2020 U.S. Census, which released a decade-long analysis (2010-2020) showing that the number of Hispanic children in the U.S. increased by more than 1 million during the decade.
The study highlighted the following results:
The data shows one in every four children, 25.7% (18.8 million), in the United States were of Hispanic origin in 2020, up from 23.1% (17.1 million) in 2010.
Top 5 states with the biggest increase
Highlighting how the Latino population has aged the fastest over the past decade, the study pinpointed the five states with the largest percentage point increases in their proportion of Hispanic children over the decade:
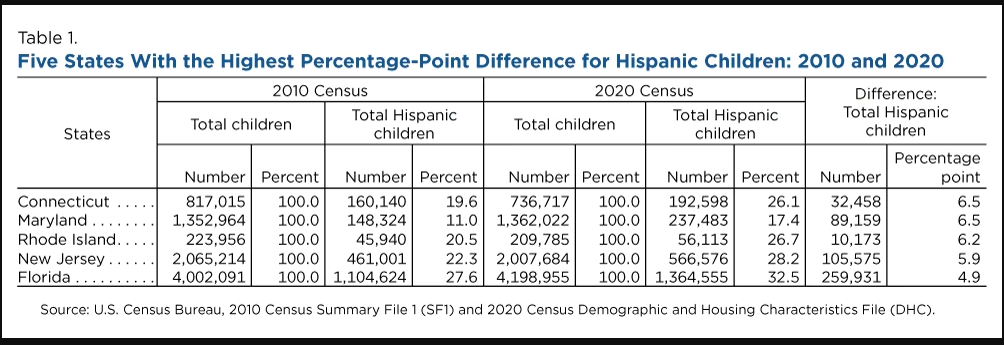
- Connecticut, up 6.5%
- Maryland, up 6.5%
- Rhode Island, up 6.2%
- New Jersey, up to 5.9%
- Florida, up 4.9%
The Census also highlighted increase certain regions over the last decade:
- New Jersey and Florida each added more than 100,000 Hispanic children
- Florida experienced the largest increase of any state, adding more than a quarter million (259,931) Hispanic children to its population between 2010 and 2020
- New Jersey and Maryland followed with 105,575 and 89,159, respectively
- In three of the five states (Connecticut, New Jersey, Rhode Island), the total number of children decreased between 2010 and 2020, while the number of Hispanic children increased.
- Southwestern states have a higher proportion of Latino children than any other state or territory outside of Puerto Rico
More findings
Another aspect highlighted by the Census looked at the average age among Hispanics.
“The Hispanic population’s median age in 2020 was 30.0, up 2.7 years from 2010. The non-Hispanic population was older, but aged at a slower rate: median age was 41.1 in 2020, up 1.5 years from 2010,” the Census analyzed.
RELATED CONTENT
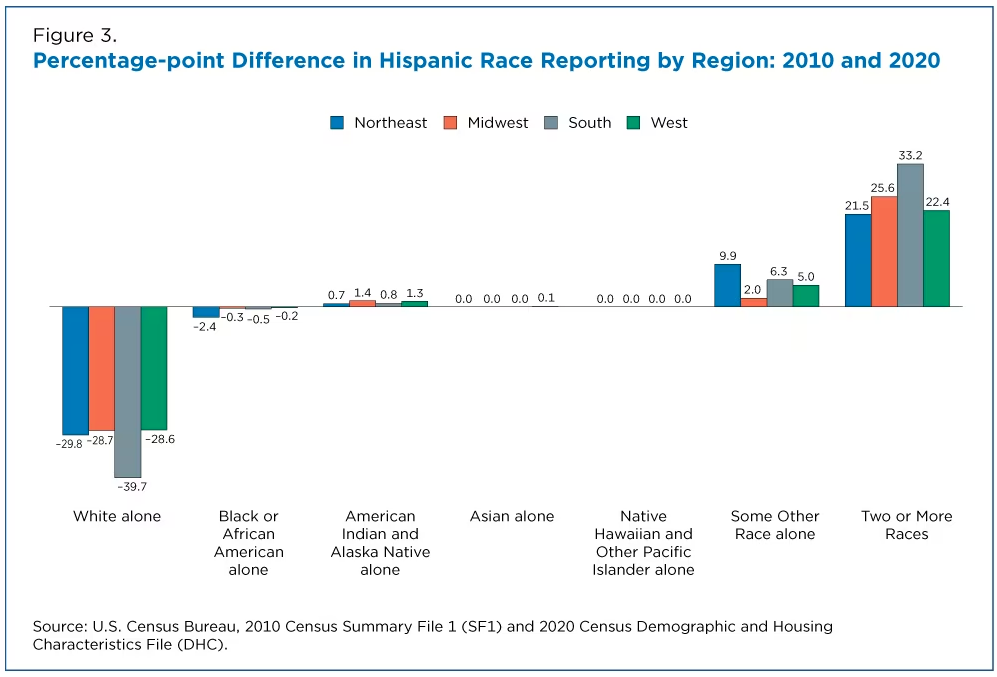
The report authors caution that comparisons between race data in the 2020 and 2010 U.S. Censuses should be made with caution, pointing to improvements in the questions about Hispanic origin and race in the way responses were coded in the 2020 Census.
New methodology
The Hispanic/Latino race and origin questions included in the 2020 Census, revised based on feedback and research, included an updated “write-in” option, and increased processing and coding capabilities.
With the new two-part question, respondents could choose to identify as Hispanic or Latino in their ethnicity section, but also identify by race.
#ICYMI: New #2020Census demographic data show that the nation’s Multiracial population had the youngest median age (29.5) of all race groups.
— U.S. Census Bureau (@uscensusbureau) June 3, 2023
Learn more about the country’s population by race and age in our #AmericaCounts story https://t.co/lucAM1LhMT #AmericaCounts pic.twitter.com/GrQan3Prxo
The Biden administration is considering combining the questions for the next U.S. census in 2030, which will allow people to choose among their Hispanic or Latino race.
“Evidence suggests the current two-part question confuses many people for whom race and ethnicity are indistinguishable. The Census Bureau found that 42% of Hispanics marked “Some Other Race” in the 2020 census. One-third selected two or more racial groups and 20% chose white as their race,” noted NBC News using 2021 Pew Research Center data.
According to Census results, Latinos describe themselves as 'two or more races,' while being the largest group, with 37.9%, among the Hispanic population surveyed in the South.
Latinos in the Northeast reported the largest increase when selecting the 'Some Other Race' category, with 48.2%, up from 38.3% in 2010. Those who identified as 'Black or African American alone' or 'Black alone' decreased the most in the Northeast, dropping from 7.2% to 4.8%.
LEAVE A COMMENT:
Join the discussion! Leave a comment.